
Reports

Your practice already generates the data — every task, workflow step, deadline and client response is recorded as work happens. Sodium's reports turn that history into answers: how fast you're delivering, which deadlines are at risk, who's overloaded, and where work is quietly stalling.

Answers, Not Spreadsheets

Each report leads with a question and answers it from your live data. Filter and group by service, client, assignee, team, or month; pick a date range or use a preset; then click straight through to the underlying tasks behind any number. Every report exports to CSV, can be pinned to your dashboard as a widget, and is available through the MCP server so you can ask your AI assistant for the numbers directly.

Reports respect your permissions — staff only see the reports and clients they're allowed to. Star the ones you use most to keep them a click away.
Your Data, Your Tools

These curated reports are a starting point, not a walled garden. Sodium is built API-first — everything you can see in the app is available through the same open API. Pull your practice data straight into Power BI, Tableau, Google Sheets, Looker Studio, or whatever reporting and BI tools you already use, and build the bespoke dashboards your practice runs on. Your data is never locked in.

Prefer to just ask? The MCP server connects Claude, Cursor, or VS Code directly to your Sodium data, so you can query it in plain English — “which clients were we slowest to turn around last quarter?” or “how many VAT deadlines did we miss this year?” — and let your AI assistant pull the answer from Sodium for you, no report or spreadsheet required.

Service Delivery Turnaround

Are you delivering client services as quickly as you should? Turnaround times, on-time and statutory compliance rates, broken down by service, client, assignee, or month — with a per-service workflow bottleneck drill-down that separates your time from client-wait time, so you can see exactly where a job slows down.

Service Delivery Turnaround report: average and median turnaround, on-time and statutory compliance rates, and a bar chart of turnaround days by service

Deadline Compliance

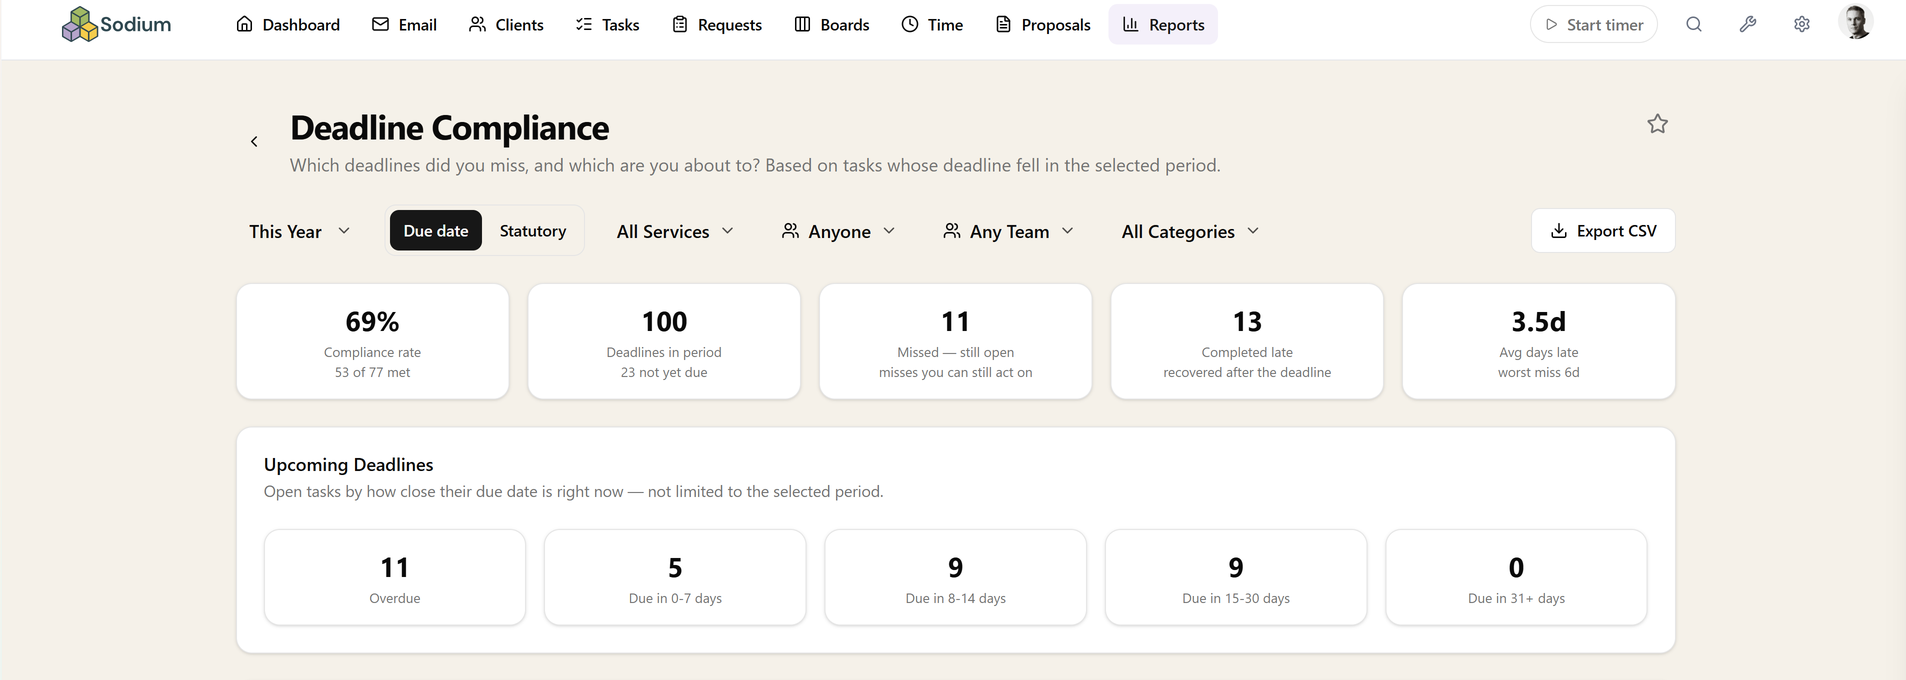
Which deadlines did you miss — and which are at risk? Every due or statutory deadline that fell in the period — met, recovered late, or missed and still open — with compliance rates by service, client, assignee, or month, plus a forward view of what's due next so nothing sneaks up on you.

Deadline Compliance report: compliance rate, deadlines in period, missed-still-open and recovered-late counts, and an Upcoming Deadlines breakdown by days remaining

Client Responsiveness

Is it us or the client? How fast clients answer the confirmations, document requests, data forms and approvals you send them, how much chasing it takes, and what's still waiting on a client right now — by client, service, or step type.

Workflow Step Analysis

For one workflow, where does the time go? Pick a workflow and see step-by-step duration spreads — median, average, p90, best and worst, with the outlier tasks one click away — across every run completed in the period, plus the slowest runs ranked worst-first.

Service Time — Estimated vs Actual

You priced each service assuming it takes X hours — does it? Time logged against each service compared with the estimated effort of the tasks it was spent on — workflow step estimates roll up into each task's budget — so you can see which services are quietly eating more time than they were priced for, with a per-client drill-down for any service. Available when time tracking is switched on.

Team Workload & Productivity

Who's overloaded, and who has capacity? Open workload per person right now — open, overdue and blocked — alongside completions, average turnaround and on-time rate over the period, grouped by user or team.

WIP / Ageing

What's sitting untouched? A live snapshot of open work by age bucket, status, service, client, assignee, or the workflow step it's stuck at — so nothing quietly rots in the pile.

WIP / Ageing report: live snapshot of open work with counts for not-started, blocked and overdue tasks, and a bar chart of open work by age bucket

Want to learn about other capabilities?

Explore all features

Have questions or suggestions?

Get in touch