
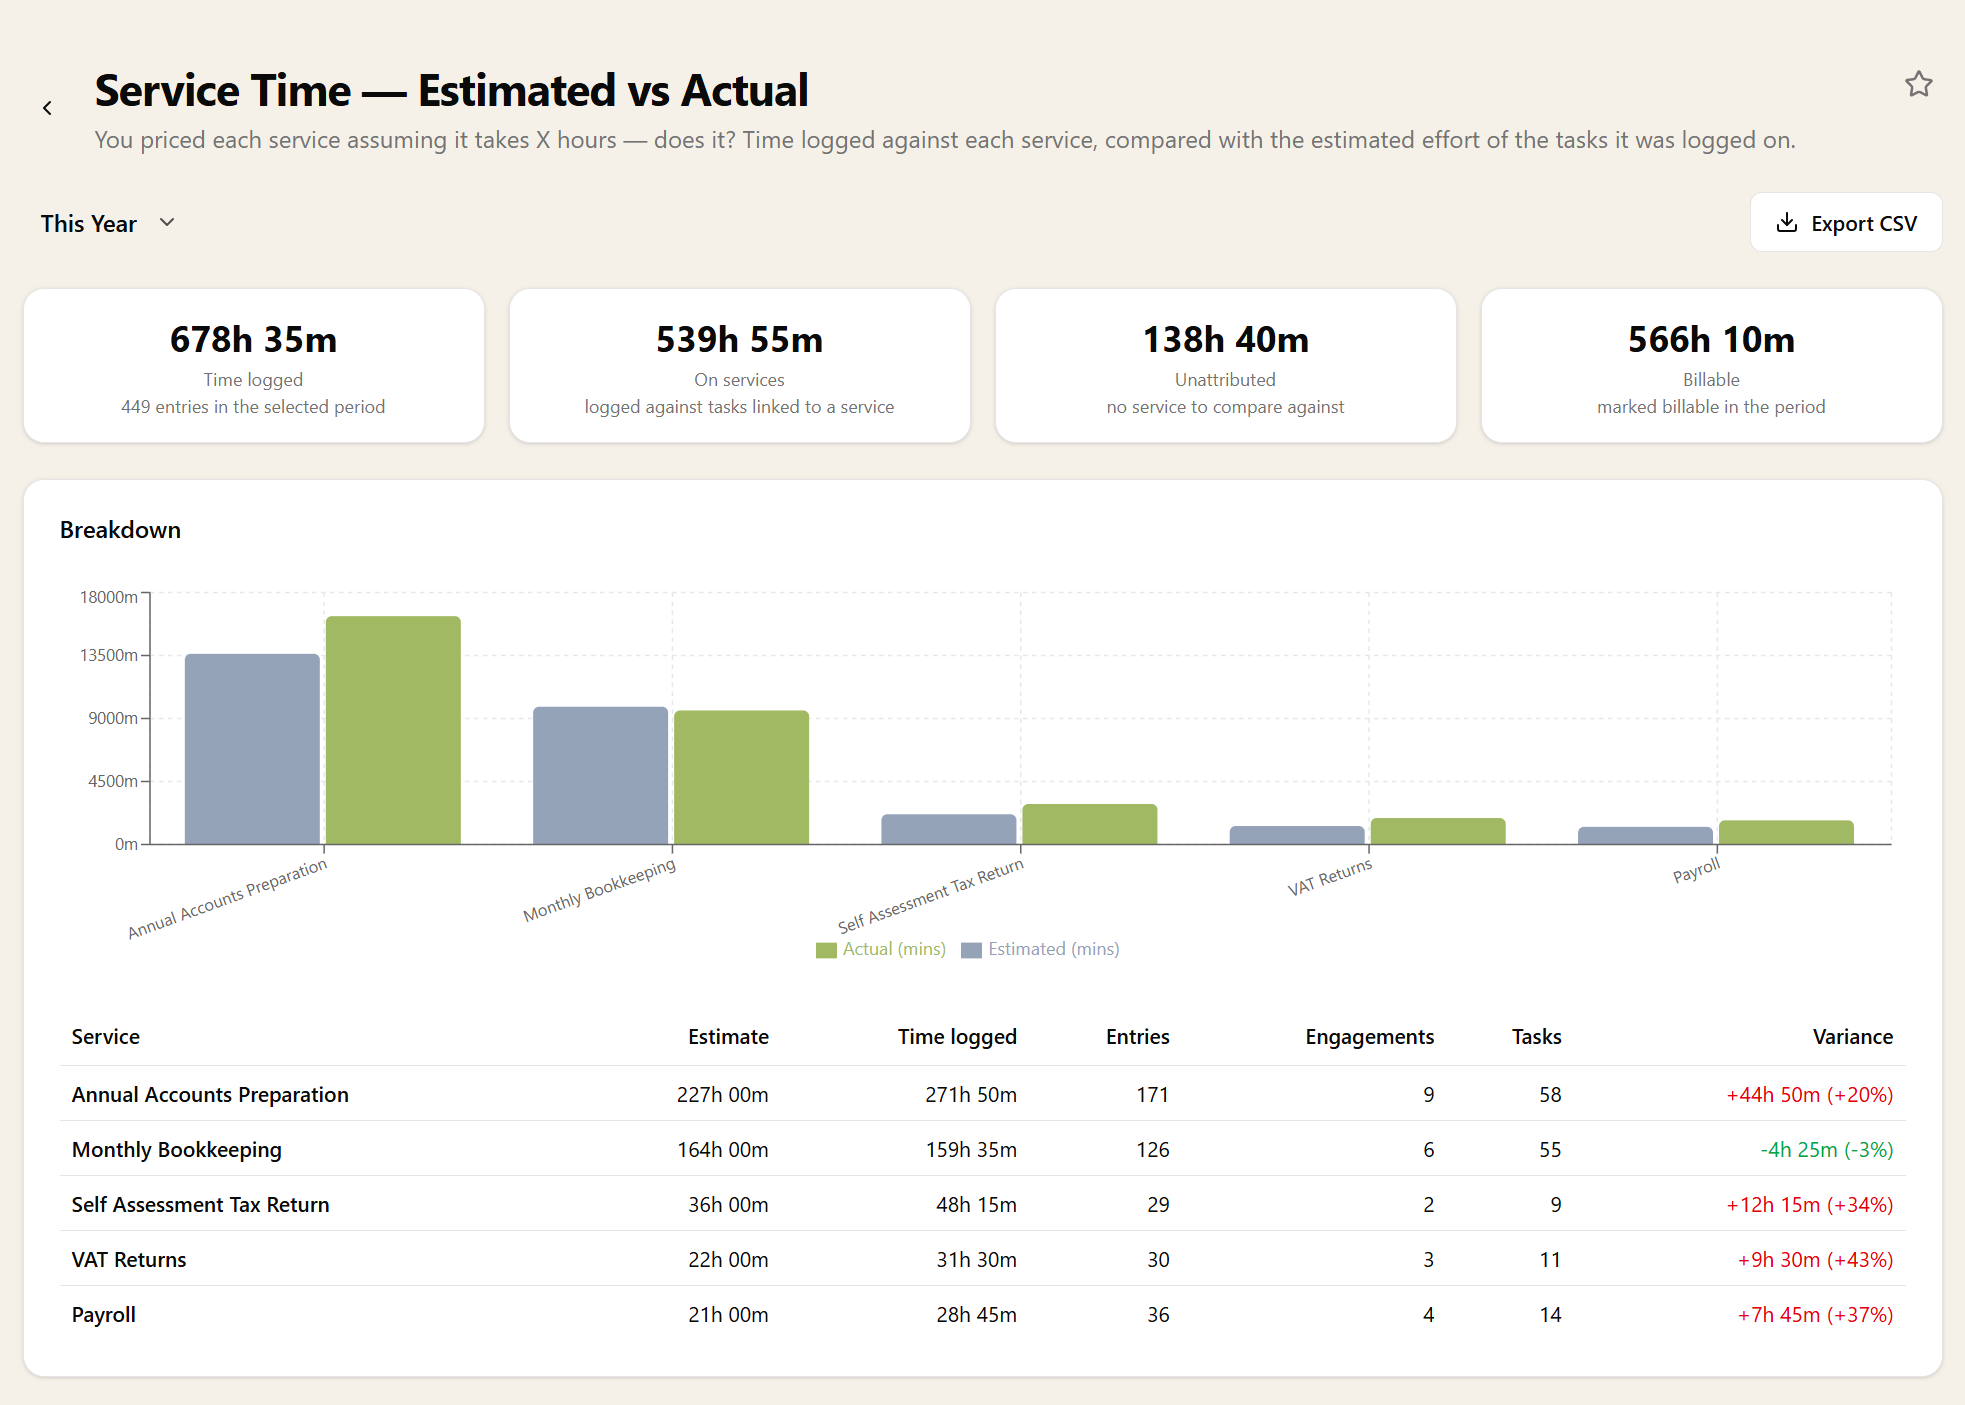
Service Time — Estimated vs Actual
You priced each service assuming it takes X hours. Does it?
Time logged against each service, compared with the estimated effort of the tasks that time was spent on — so the services quietly eating more hours than they were priced for stop being invisible. Drill from a service down to a client, a task and a single workflow step to find where the hours actually went.
Where the estimate comes from
Workflow step estimates roll up into each task's budget, so the expected figure is built from the way you already described the work rather than from a number someone typed into a pricing spreadsheet once and never revisited. Where a task's estimate is set by hand instead, that figure is used.
There is no service-level fallback estimate, which is deliberate. If the steps do not carry estimates the row shows no expectation rather than an invented one, because a made-up baseline is worse than an honest gap — it makes an unpriced service look fine.
Pricing that reflects reality
A service that runs consistently over its estimate is either underpriced or badly scoped, and both are fixable once you can see it. The per-client drill-down on any service matters just as much: often a service is profitable across the board except for two clients whose work looks nothing like the rest.
That drill-down is where fee conversations start. "Your bookkeeping takes us twice as long as everyone else's" is a hard thing to say and an easy thing to prove, and the second is what makes the first possible.
Billable, unbillable and unattributed
Each row separates billable from total hours, so you can see the work you can recover as well as the work you did. A service can be comfortably inside its estimate and still be losing money if half the hours are unbillable.
Time that cannot be attributed to any service — logged against something with no service behind it — is reported as its own figure rather than being quietly dropped or spread across the rows. If that number is large, the service totals underneath it are only part of the picture, and you should be able to tell.
From service to client, task and step
Set a period, then drill into a service to see its clients, into a client to see its tasks, and into a task to see its workflow steps. Every level shows estimate, time logged and variance, and each level's rows add up to the row you drilled from, so nothing goes missing on the way down.
The step level is where an over-budget job explains itself. Steps with an estimate appear even if nobody has logged time against them yet, so "two hours planned, nothing logged" shows up alongside "one hour planned, four logged". Time logged against a client's service but not against a task, or against a task but not a step, gets its own row rather than disappearing.
Grouped by team member
Switch the grouping to team member to see each person's logged time against the estimates assigned to them. Time counts for whoever logged it; the estimate counts for whoever the step or task is assigned to, and anything assigned to a team or to nobody sits on an Unassigned row. Narrow it to one service to ask who goes over on Annual Accounts.
Someone who helps out on another person's step shows as over, with no estimate of their own, while the step's owner looks under. That is the point: it shows who actually did the work, not just who was down to do it.
Getting it out
Row counts show how many tasks and engagements the hours came from, so a startling average can be checked against how much work it is actually describing. The CSV export follows whatever level is on screen — services, clients, one client's tasks, one task's steps, or team members — ready for a pricing review. Pin the report to your dashboard, or query it through the MCP server.
This report needs time tracking switched on.
Related reports
These answer the question next door. If this report tells you something is wrong, one of them usually tells you why.
Related features
The parts of Sodium this report reads from — set these up and the report fills itself in.