
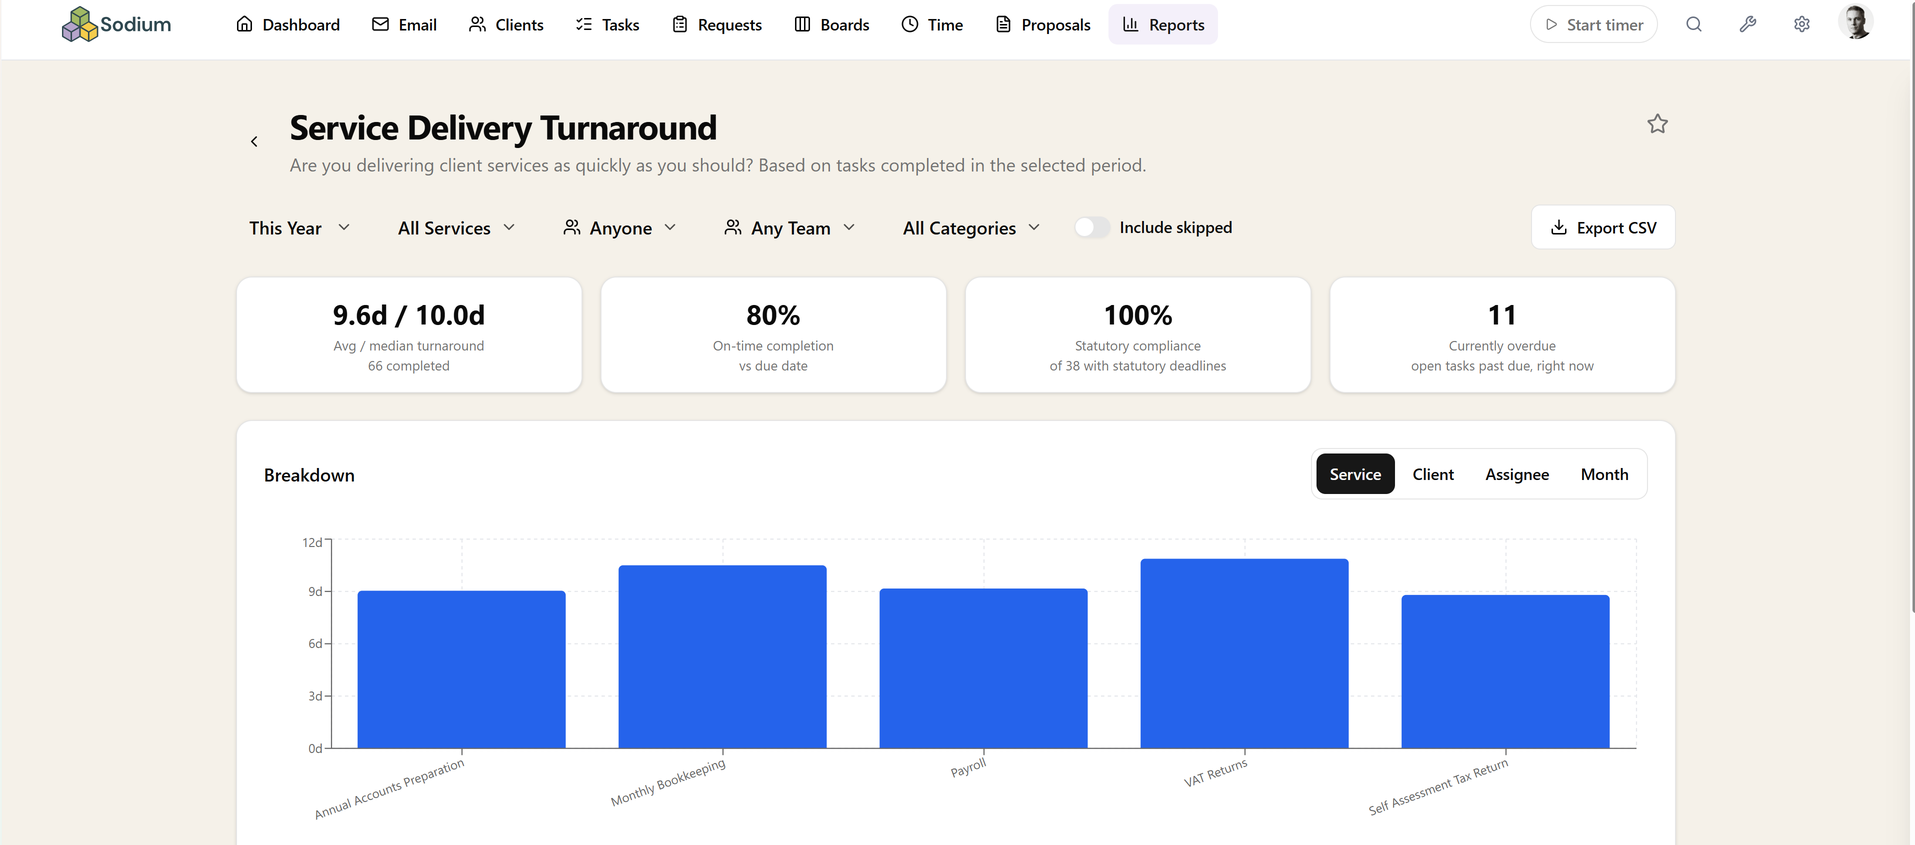
Service Delivery Turnaround
Are you delivering client services as quickly as you should?
Turnaround times, on-time rates and statutory compliance, broken down by service, client, assignee or month — built from the dates your tasks already carry, so there is nothing to maintain.
Where a job actually slows down
The per-service drill-down separates your time from client-wait time. That distinction is the whole point: a job that took six weeks because a client sat on their records is a different problem from one that took six weeks because it queued on someone's desk, and an average turnaround figure on its own cannot tell you which you have.
Break the same period down by assignee to see whether a slow service is slow everywhere or slow for one person, and by month to see whether it is getting better or worse.
On time and on time by law
On-time rate and statutory compliance rate are reported separately, because they are not the same promise. Missing your own internal target on a set of accounts is a service problem you can absorb; missing the filing deadline behind it is not, and a single blended percentage lets the second hide inside the first.
Average and median turnaround sit side by side for the same reason. Where they diverge sharply, the average is being dragged by a handful of jobs rather than describing the typical one — and those jobs are the ones worth opening.
What it is built from
Every task records when it started and when it completed, and services carry their own statutory dates. The report reads that history directly — no separate time entry, no one filling in a tracker.
That matters for trust as much as convenience. Nobody has to remember to update anything for the numbers to be right, so the report cannot quietly drift out of date the way a manually-maintained turnaround spreadsheet always does.
Filtering, drilling in, and getting it out
Pick a preset period or set your own dates, then narrow by service, client or task category and switch the grouping without losing your place. Any figure in the table clicks through to the tasks behind it, so a suspicious number leads to the specific jobs that caused it rather than to more aggregation.
Every view exports to CSV, can be pinned to your dashboard as a widget, and is reachable through the MCP server if you would rather just ask for the number in plain English.
Related reports
These answer the question next door. If this report tells you something is wrong, one of them usually tells you why.
Related features
The parts of Sodium this report reads from — set these up and the report fills itself in.