
Cost & Profit
What did your team's time cost — and what is it worth?
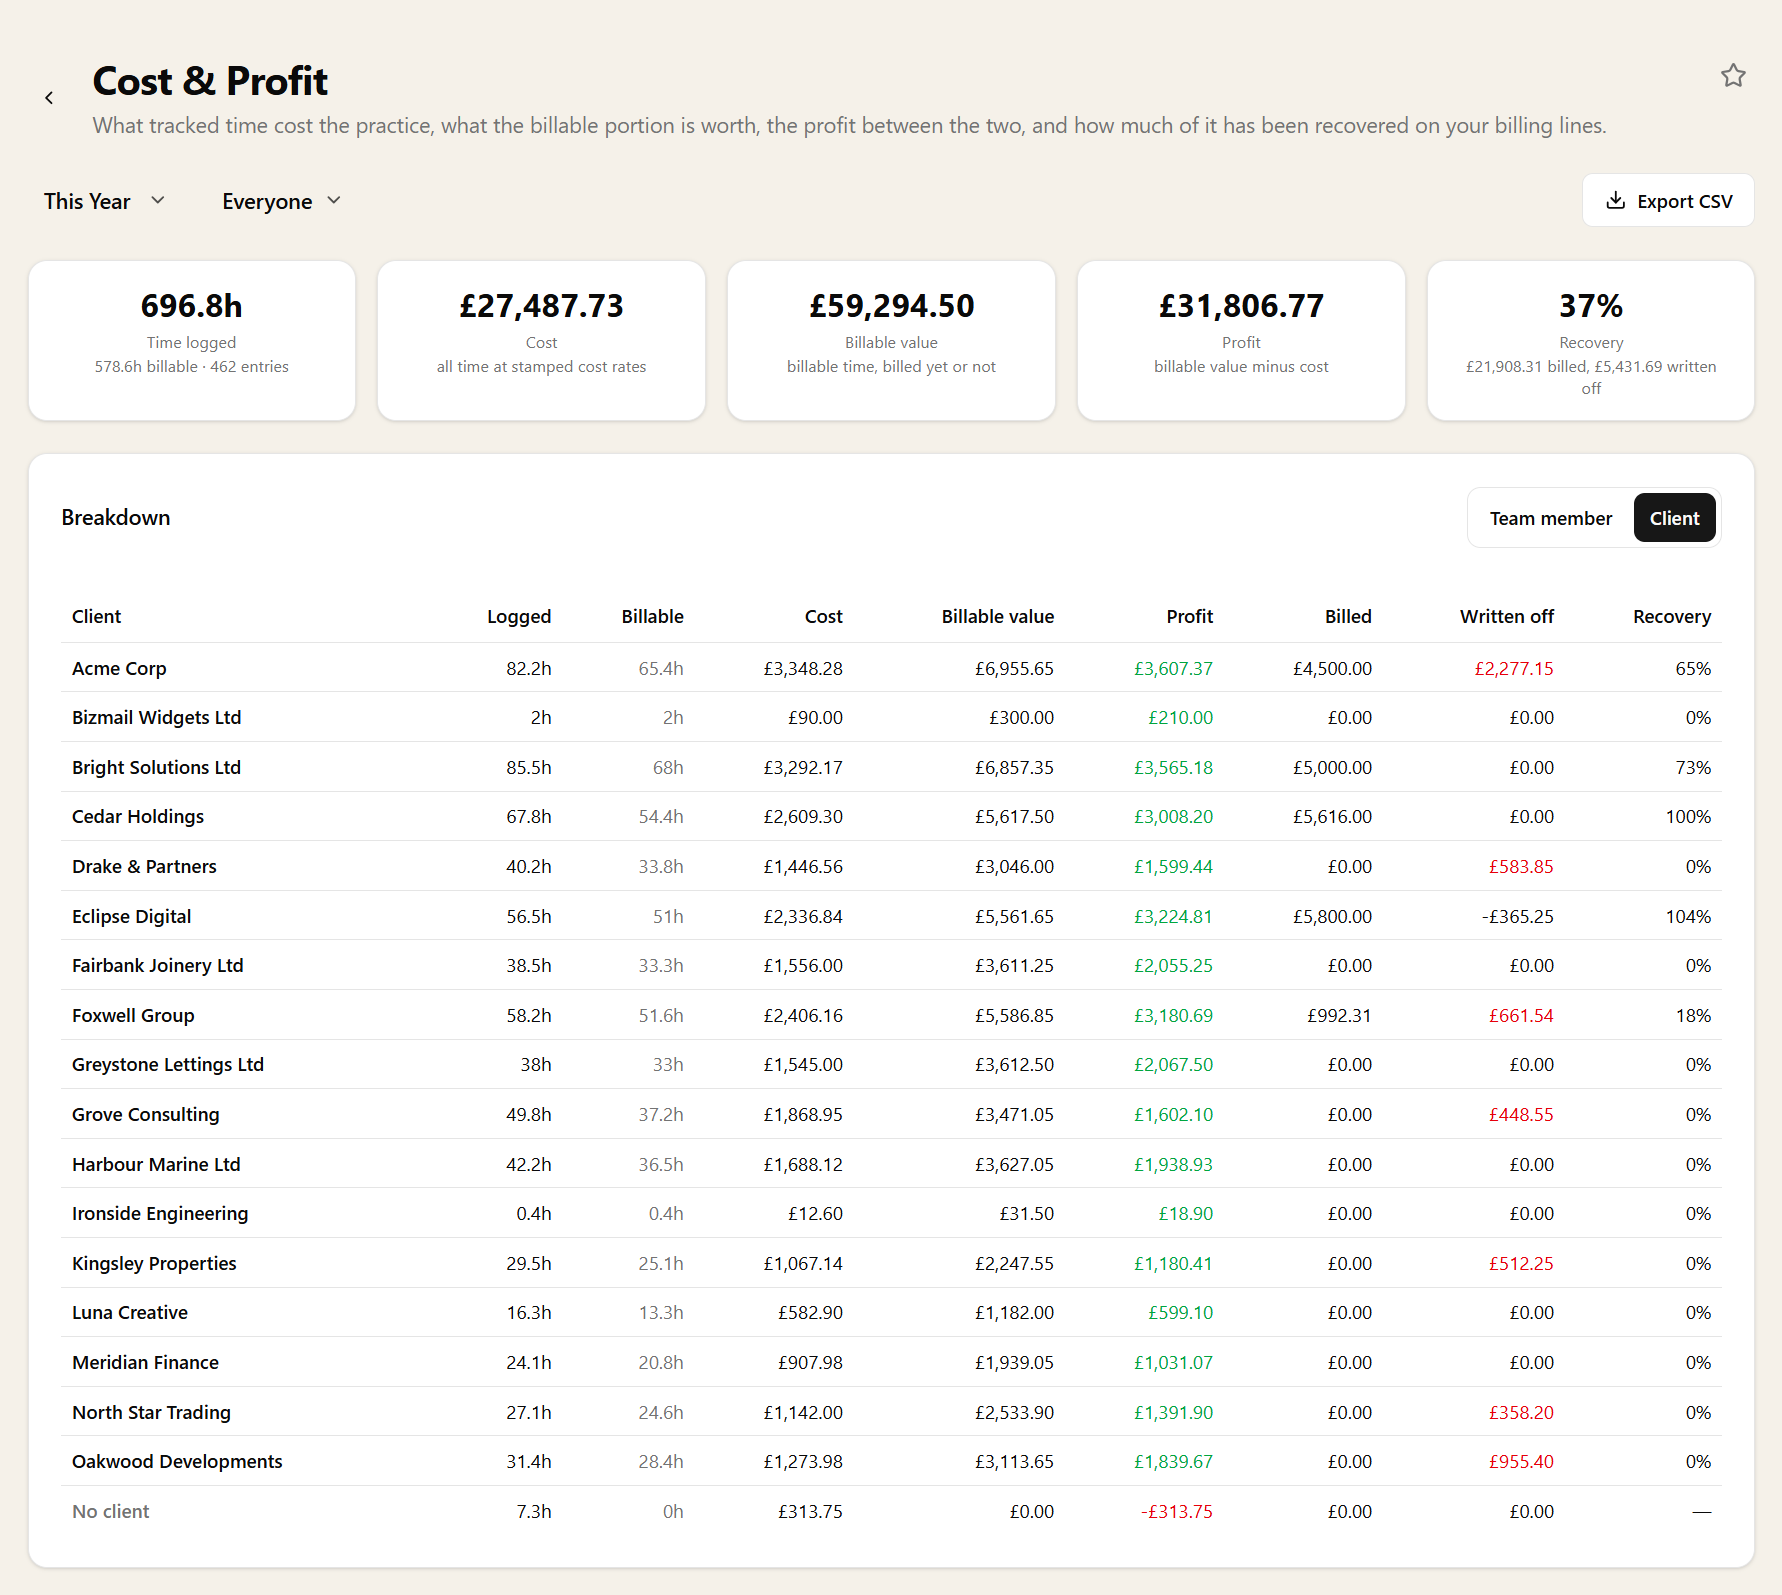
Every hour your team logged, valued at what it cost the practice, set against what the billable part of it is worth — with the difference shown as profit, per team member or per client.
It is the report that turns “we think that client is marginal” into a number you can act on.
Cost is a rate, not a guess
Every team member can carry a cost rate alongside their charge-out rate — what an hour of their time actually costs the practice. Time is valued at the cost rate that applied on the day it was logged, so a pay rise this month does not quietly rewrite what last year's work cost.
Cost is recorded whether or not the time was billable, because unbillable hours cost exactly as much as billable ones. That is the entire point: a client who absorbs six hours of unbilled queries costs you the same as one who absorbs six billable hours and pays for them.
Per client, or per person
Grouped by client, the report answers the awkward question directly: which clients are we making money on? A fixed monthly fee and a creeping workload is the classic way a good client becomes a bad one, and it never announces itself — it shows up here as a shrinking profit column, months before anyone notices in the bank.
Grouped by team member, it shows your true cost of delivery and where recoverable value is being produced. Read it as a picture of the work, not a scoreboard: the person with the lowest billable value may be the one absorbing everything nobody else wants to do.
Billable value, not invoiced value
The value column is what the billable time is worth at the rates it was logged at — billed already or not. That is deliberate: this report is about whether the work is worth doing, which is a different question from whether you have got round to invoicing it, or what you eventually charged.
Time logged before a member had a cost rate carries no cost, and rather than pretending otherwise the report counts those entries and flags them on the row. A profit figure with a quiet hole in it is worse than one that tells you where the hole is.
How much of it actually came back
Alongside what the time was worth, every row shows what has been billed against it, what was written off, and the recovery rate between the two. Profit on paper and profit in the bank are different numbers, and a client can be comfortably profitable at charge-out rates while recovering sixty per cent of them once the fixed fee is applied.
Recovery is billed value as a share of billable value, and a write-on — a fee that came in above the hours behind it — counts in the client's favour. The headline Recovery figure sits beside Profit for exactly that reason: one says whether the work was worth doing, the other whether you were paid for it.
Who can see it
Cost rates are the most sensitive numbers in the practice, so they sit behind their own permission rather than riding along with reports. Without it a team member does not see cost rates, does not see this report, and does not find it referenced anywhere — there is nothing to ask about.
Anyone restricted to their own time is closed out of it entirely, for the same reason they cannot see the practice-wide time reports.
Filtering, drilling in, and getting it out
Pick a period, narrow to one team, and switch the grouping between team member and client without losing your place. Time with no client behind it gets its own row at the foot rather than being dropped, so the totals still add up.
Export to CSV for a partners' meeting or a pricing review, or pin it to your dashboard.
This report needs time tracking switched on.
Related reports
These answer the question next door. If this report tells you something is wrong, one of them usually tells you why.
Related features
The parts of Sodium this report reads from — set these up and the report fills itself in.